

In Lesson 4 of “Practical Deep Learning for Coders” by fast.ai, we discover how to how to use deep learning and collaborative filtering to solve tabular data problems. As I always do with the fast.ai lectures, I watched the lecture through once, then watched it again as I ran through the notebooks, pausing as needed. When I finished that, I wanted to make sure I could replicate the process with a different dataset, and I chose the Kaggle dataset “A Waiter’s Tips” by Joe Young. With this dataset, we want to make a model to predict the tip amount for a waiter in a restaurant.
I start by downloading dataset and unzipping it, checking for missing values (there are none!), then uploading the tips.csv file to the ‘data’ folder in the working directory.
After from fastai.tabular import * , I need to edit the notebook to make the path point to the right place, since the notebook default path points to the dataset used in the lecture. My data is in the ‘data’ folder, so I set the path accordingly, and tell it to store the data in a Pandas DataFrame:path = Path(‘data’)
df = pd.read_csv(path/’tips.csv’)
Then I set up the column names, dependent variable, and preprocessing functions. Since I want to predict the tip amount based on the other factors I set tip as the dependent variable, and since sex, smoker status, andday of the week can be selected from short lists of possibilities, I set those as “categorical” variables. The total_bill and the size are just numbers, so those are “continuous” variables. I had to think for a minute about thetime of day, though: “time” feels like a continuous idea, but looking at the data, I see that “time” is defined as being either “lunch” or “dinner.” Categorical, then.
The preprocessing functions FillMissing, Categorify, and Normalize come with the notebook, and I keep them as they are for now.dep_var = 'tip'
cat_names = ['sex', 'smoker', 'day', 'time']
cont_names = ['total_bill', 'size']
procs = [FillMissing, Categorify, Normalize]
(This California girl was surprised to see ‘smoker’ listed as a possible attribute of a restaurant patron)
Next, I need to choose a size for my test set. We usually set aside 20% of the data for the test set, so since my dataset has 244 elements, I set the test set to use a range of indices from 196–244.test = TabularList.from_df(df.iloc[196:244].copy(), path=path, cat_names=cat_names, cont_names=cont_names)
Then it’s time to use the fastai library’s Datablock API to create my databunch:data = (TabularList.from_df(df, path=path, cat_names=cat_names, cont_names=cont_names, procs=procs)
.split_by_idx(list(range(196,244)))
.label_from_df(cols=dep_var)
.add_test(test)
.databunch())
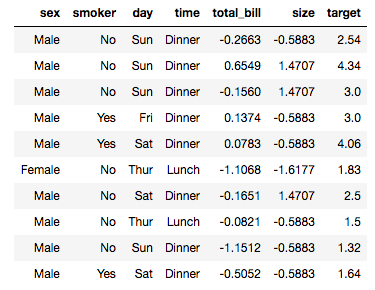
I check out a batch of the data:
data.show_batch(rows=10)

The total_bill and size often have negative values? I don’t think the restaurant paid any patrons to eat there, so this must a result of the call to the Normalize preprocessing. I check the docs and don’t find what Normalize actually does, so I return to the detailed lecture notes and find this:
“Normalize : Do a normalization ahead of time which is to take continuous variables and subtract their mean and divide by their standard deviation.” Okay, then this is just the same as a z-score in statistics, so it makes sense that values below the mean would be negative.
I declare my learner, telling the API that it’ll be a tabular learner (as opposed to a convolution neural network learner, for instance), and keep the parameters used in the lecture:
learn = tabular_learner(data, layers=[200,100], metrics=accuracy)
Then I run learn.fit , and get an error:
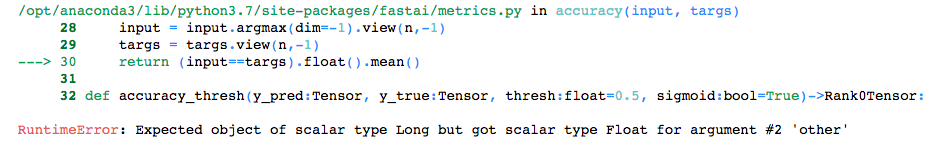
It looks “argument #2” in the accuracy function is targs, but it’s not obvious to me how I need to go about fixing this. I Google the error, and find a post on it. So yes, targs is “argument #2”, and I need to make my own accuracy function. The accuracy function was called when I created a learner, so I create a new cell above that one, and define a new accuracy function, called accuracy_long , which is identical to the original accuracy function, except for the.long() addition on the fourth line:def accuracy_1ong(input:Tensor, targs:Tensor)->Rank0Tensor:
n = targs.shape[0]
input = input.argmax(dim=-1).view(n,-1)
targs = targs.view(n,-1).long()
return (input==targs).float().mean()
… and run both cells in order. It wouldn’t be any fun if we didn’t get another error, right?
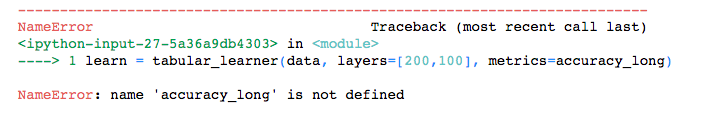
And I’m like “I did too define it! See, just up there?”
*hours of Googling and thinking I can’t even define a function and should definitely give up on coding later* Look closely at what I typed up there. The ‘l’ in accuracy_long is a ‘1’. Cool, cool.
I give the computer a long, cold stare, then carry on recreating my learner and running learn.fit(1, 1e-2) . And check out my accuracy rate! It‘s strongly related to what I’d like my accuracy rate to be, in that they are exact opposites. 🙄
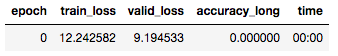
Since this dataset came to me pre-cleaned with a cherry on top, and was designed to predict exactly what I’m trying to use it to predict, it seems like my accuracy rate should be great, not precisely awful. So I wonder if I accidentally inverted some logic somewhere, and comb through the code. I don’t find anything, though.
Hmm. I don’t think it could be this, but I’ll try not normalizing the data? Nope, no improvement.
Unlike the Lesson 2 notebook, the Lesson 4 notebook doesn’t start the learning with fitting just one cycle over several epochs, nor does it run the learning rate finder or confusion matrix. I’ll just pop those in myself.
I create and run five new cells: learn.fit_one_cycle(4) , learn.save(‘stage-1’) , learn.unfreeze() , learn.lr_find() , and learn.recorder.plot() . Here’s the learning rate chart:
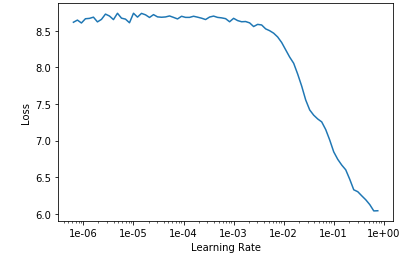
Looking at the chart, it doesn’t look like changing the learning rate is going to help me.
I’m officially out of ideas, so I turn to the fast.ai forum. A member responds with advice to try the RMSE (root mean squared error) technique used in Lesson 6, so I’ll pause for now and try this again after Lesson 6.
Check out the code on GitHub!
Other posts on this topic:
Lesson 1: Getting Started With fast.ai
Lesson 2: Classifying Pregnancy Test Results!
Lesson 2 (the sequel): Can Deep Learning Perform Better than Pigeons?
Lesson 3: 10,000 Ways that Won’t Work
Lesson 5: But Where Does the Pickle Go?
Lesson 6: Everybody Wants to be a Cat
I’m a mathematics lecturer at CSU East Bay, and an aspiring data scientist. Connect with me on LinkedIn, or say hi on Twitter.